Overview
MathPlot is a powerful and free Canva app for 2d mathematical functions and data.
Create stunning graphs and charts with ease without leaving Canva using the popular MathJs Syntax. Whether you’re a student, educator, or professional, MathPlot simplifies visualising complex mathematical concepts and lets you plot:
- linear functions (e.g.
F(x)=x^3); - parametric functions (e.g.
X(t)=sin(t)andY(t)=sin(t)); - polar functions (e.g.
R(θ)=sin(2*θ)); - connected points;
- vectors;
- text;
- 🆓 Free!
- 📈 2D plots
- 🧮 MathJS syntax
- 🎛️ Custom axes
- 🎨 Canva export
How it works
The following image illustrates MathPlot’s interface and capabilities:
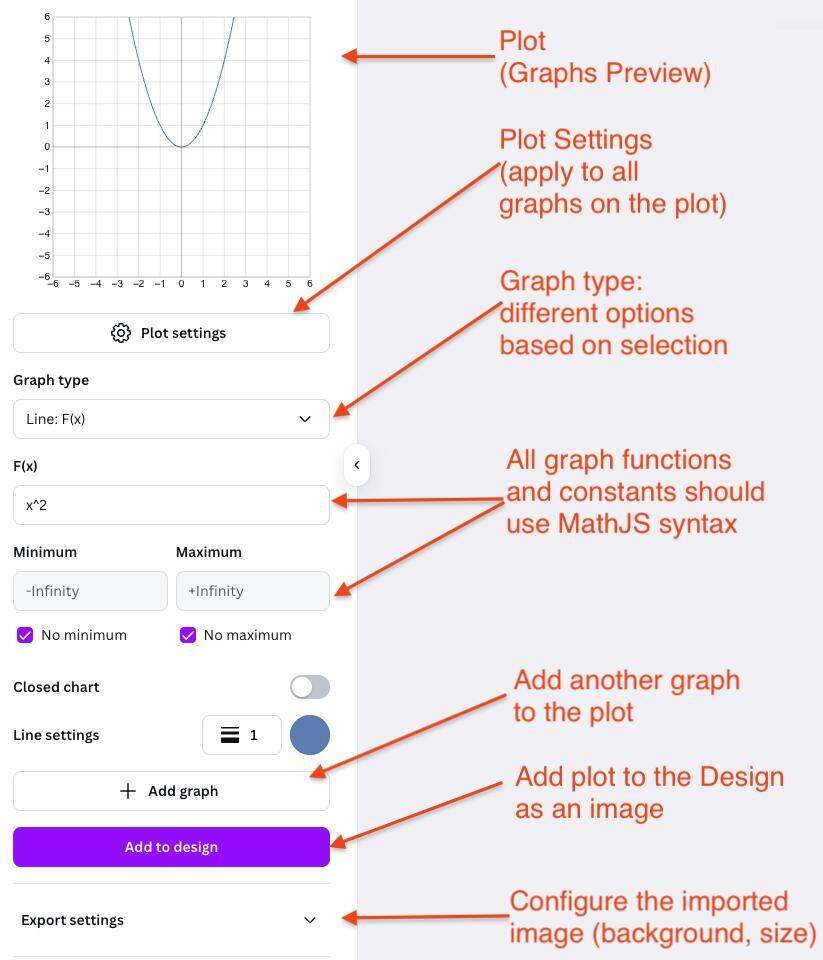
MathPlot offers a plot, where you can preview
the graph before you insert it. The plot is configurable from
a menu button underneath, and can be insterted into the design
from the +Add button.
Below are the graph configurations. You need to have at least
one graph on the plot. You can add more graphs from the
Add Graph button.
Each graph has a type and based on this selection you can
provide suitable configurations. All formulas and
constants use MathJS expressions (e.g. x^2, sin(x)) and constants (e.g. PI, E, Infinity).
For more details, review the MathJS Docs.
Configure the plot
The following annotated screen illustrates how to configure the plot:
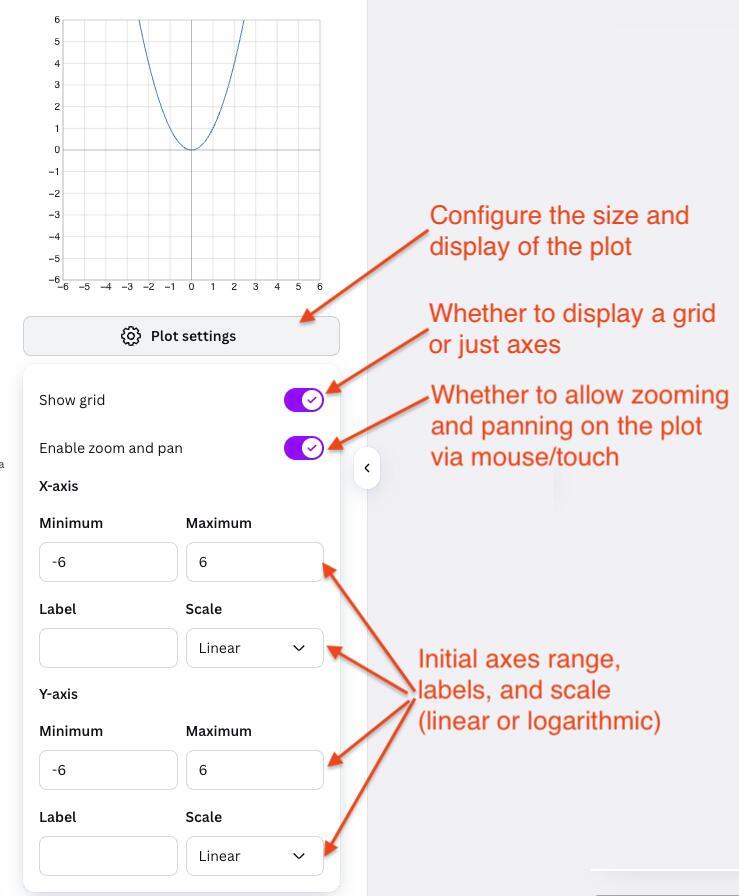
You can:
- swtich on/off the grid;
- disable the zooming and panning;
- specify ranges for the X and Y axes;
- specify axes labels;
- configure linear or logarithmic scale for the axes.
Manage multiple graphs
If you have multiple graphs, they will be presented in an expandable “accordion”, as depicted below:
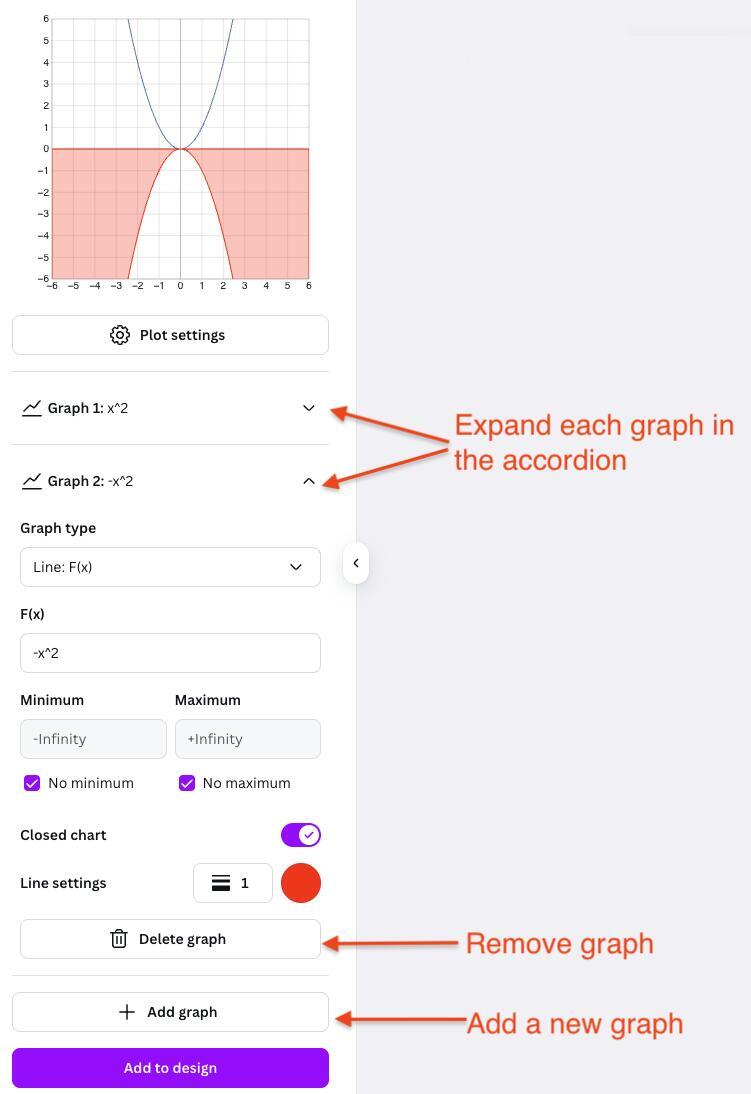
Each graph can be removed from x button in its the top
right corner of its configuration.
Add to design
Once you are happy with the plot and ready to insert it,
please lick the +Add button, as depicted below:
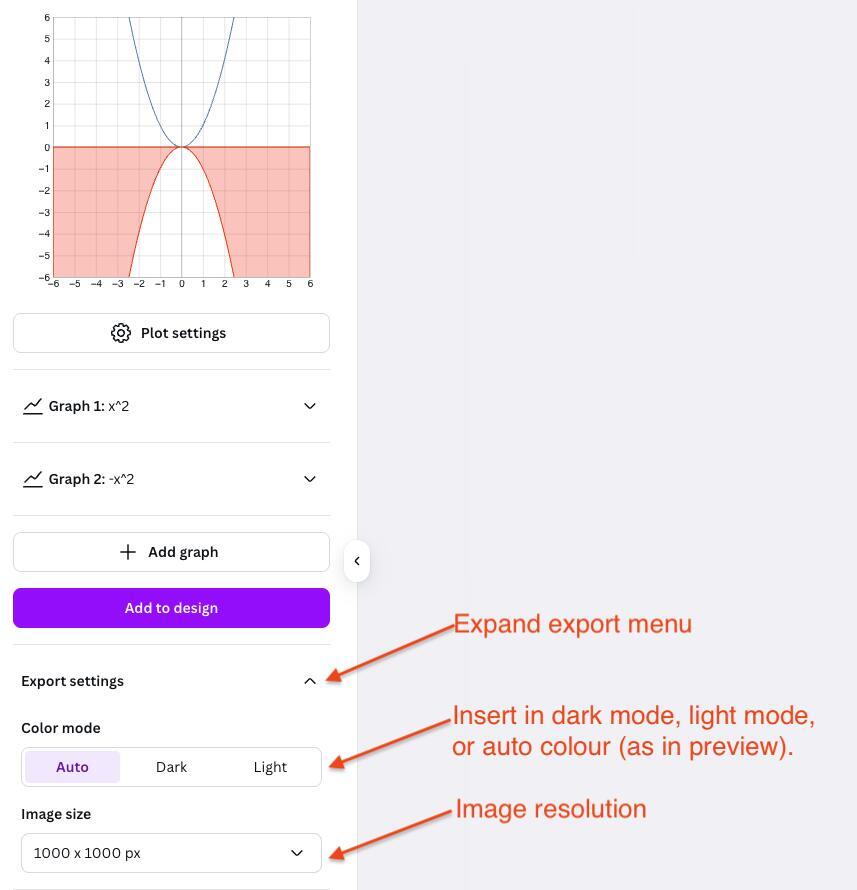
It will open a menu, where you can select:
- the colour mode (current, dark, or light);
- the image resolution.
Stay tuned!
Stay tuned for more demos and tutorials. Until then, feel free to email us for any inquiries or support.